Environmental Indicators
GRI 103-1, 103-2, 103-3, 302-5, 303-1, 303-5, 305-1, 305-2, 305-4, 305-5, 306-2
| Consumption per pair | 2017/18 | 2018/19 | 2019/20 | Change in % on previous year |
|---|---|---|---|---|
| Primary energy (kWh) | 0,439 | 0,484 | 0,553 | 14% |
| of which CO2-neutral % | 100% | 100% | 100% | 0% |
| Secondary energy (kWh) | 0,287 | 0,277 | 0,306 | 10% |
| of which CO2-neutral % | 100% | 100% | 100% | 0% |
| Water (litres) | 3,561 | 3,895 | 4,459 | 14% |
| Total Waste (kg) | 0,029 | 0,032 | 0,043 | 36% |
| of which direct recycling | 17% | 16% | 16% | -1% |
| relative CO2-emissions (kg) | 0,022 | 0,023 | 0,026 | 13% |
| Consumption per unit | 2017/18 | 2018/19 | 2019/20 | Change in % on previous year |
|---|---|---|---|---|
| Primary energy (kWh) | 0,077 | 0,070 | 0,061 | -13% |
| of which CO2-neutral % | 100% | 100% | 100% | 0% |
| Secondary energy (kWh) | 0,507 | 0,492 | 0,430 | -12% |
| of which CO2-neutral % | 100% | 100% | 100% | 0% |
| Water (litres) | 0,331 | 0,233 | 0,315 | 35% |
| Total Waste (kg) | 0,023 | 0,022 | 0,016 | -27% |
| of which direct recycling | 31% | 36% | 55% | 53% |
| relative CO2-emissions (kg) | 0,018 | 0,017 | 0,015 | -12% |
| Consumption per unit | 2017/18 | 2018/19 | 2019/20 | Change in % on previous year |
|---|---|---|---|---|
| Primary energy (kWh) | 3,280 | 3,026 | 3,526 | 17% |
| of which CO2-neutral % | 100% | 100% | 100% | 0% |
| Secondary energy (kWh) | 4,638 | 4,453 | 4,324 | -3% |
| of which CO2-neutral % | 100% | 100% | 100% | 0% |
| Water (litres) | 5,382 | 5,258 | 4,824 | -8% |
| Total Waste (kg) | ||||
| of which direct recycling | ||||
| relative CO2-emissions (kg) | 0,238 | 0,224 | 0,236 | -8% |
Primary energy is used solely to heat rooms, but as a result of lower production figures, the relative consumption increases.
| Consumption per pairs | 2017/18 | 2018/19 | 2019/20 | Change in % on previous year |
|---|---|---|---|---|
| Primary energy (kWh) | 0,484 | 0,552 | 0,535 | -3% |
| of which CO2-neutral % | 0% | |||
| Secondary energy (kWh) | 1,723 | 1,780 | 1,914 | 8% |
| of which CO2-neutral % | 15% | 100% | 100% | 0% |
| Water (litres) | 0,598 | 0,622 | 0,661 | 6% |
| Total Waste (kg) | 0,444 | 0,419 | 0,440 | 5% |
| of which direct recycling | 36% | 36% | 33% | -8% |
| relative CO2-emissions (kg) | 0,898 | 0,186 | 0,075 | -60% |
| Consumption per 100 pair | 2017/18 | 2018/19 | 2019/20 | Change in % on previous year |
|---|---|---|---|---|
| Primary energy (kWh) | ||||
| of which CO2-neutral % | ||||
| Secondary energy (kWh) | 0,327 | 0,276 | 0,312 | 13% |
| of which CO2-neutral % | 100% | 100% | 100% | 0% |
| Water (litres) | 0,210 | 0,185 | 0,159 | -14% |
| Total Waste (kg) | 0,017 | 0,013 | 0,013 | -2% |
| of which direct recycling | 19% | 25% | 17% | -35% |
| relative CO2-emissions (kg) | 0,010 | 0,009 | 0,010 | 12% |
| The secondary energy is used to a large extent for heating the rooms, due to lower production figures, the relative consumption therefore increases. The lower water consumption can be explained by the move to a new building. | ||||
| Consumption per unit | 2017/18 | 2018/19 | 2019/20 | Change in % on previous year |
|---|---|---|---|---|
| Primary energy (kWh) | ||||
| of which CO2-neutral % | ||||
| Secondary energy (kWh) | 0,912 | 0,882 | 0,892 | 1% |
| of which CO2-neutral % | ||||
| Water (litres) | 1,319 | 1,408 | 1,095 | -22% |
| Total Waste (kg) | 0,014 | 0,012 | 0,018 | 52% |
| of which direct recycling | 87% | 100% | 100% | 0% |
| relative CO2-emissions (kg) | 0,763 | 0,738 | 0,747 | 1% |
CO2 emissions of uvex safety group (in tons)
| 2015/2016 | 2016/2017 | 2017/2018 |
|---|---|---|
| 4,642 | 4,340 | 3,583 |
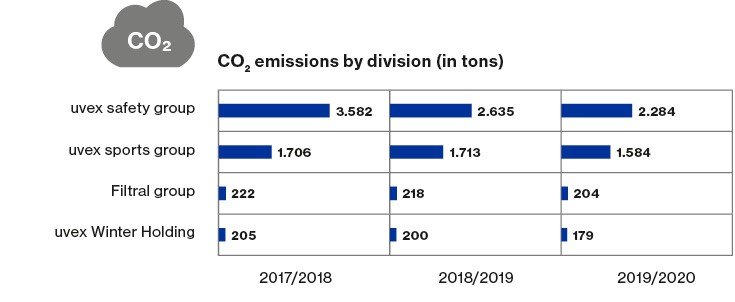
| 2017/18 | 2018/19 | 2019/20 | |
|---|---|---|---|
| uvex safety group | 3.582 | 2.635 | 2.284 |
| uvex sports group | 1.706 | 1.713 | 1.584 |
| Filtral group | 222 | 218 | 204 |
| uvex Winter Holding | 205 | 200 | 179 |